
Is Earth’s Large-Scale Structure Random?
New research tests whether Earth’s biggest geological systems show hidden order; using mathematics, not speculation.

🌍 A simple question with a hard answer
Earth’s surface is full of striking patterns.
Tectonic plates trace vast arcs across the planet.
Mid-ocean ridges form near-continuous global networks.
Earthquakes cluster along long-lived belts.
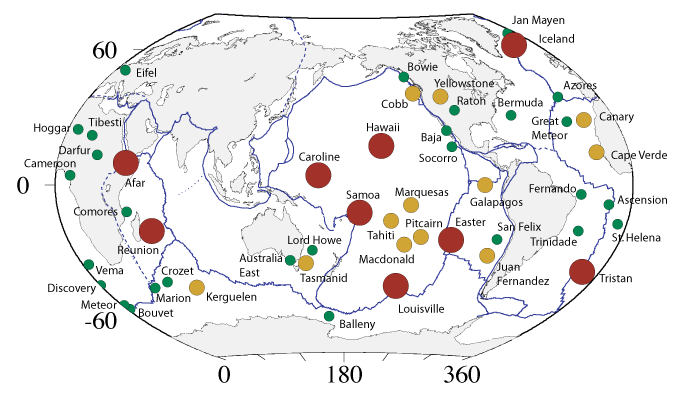
Volcanoes and mantle hotspots trace deep processes we still don’t fully understand.
We have solid physical explanations for how these features form: plate tectonics, mantle convection, stress accumulation, and plume dynamics.
But there’s a deeper question that is rarely tested quantitatively:
When we look at Earth’s largest systems all at once, do they show more global-scale organization than we would expect by chance alone?
The question addressed here is statistical rather than speculative.
How do you test “global organization”?
To test large-scale structure, you need a neutral reference, something that does not already assume Earth’s physics.
In my recent study, I used highly symmetric spherical point patterns as reference grids. These grids are not proposed as physical models of Earth. Instead, they act like measuring sticks for global order.
One family of these reference patterns comes from a mathematical object called E8, known for its extreme symmetry and uniformity. On a sphere, it provides a very even, unbiased distribution of directions, ideal for asking whether Earth’s systems are more organized than random.
Crucially, the grid is allowed to rotate freely. The analysis does not fix its orientation in advance.
The hardest part: avoiding false patterns
If you rotate a grid long enough, you will always find something that looks aligned.
To avoid fooling ourselves, the study uses search-aware statistics:
Every alignment found in real data is compared against thousands of randomised Earths.
Each randomised case is given the same level of optimisation freedom.
This controls for the “you searched until you found something” problem.
Only alignments that outperform these conservative null models are considered meaningful.
What was tested?
Five independent global datasets were analysed using the same method:
Tectonic plate boundaries
Mid-ocean ridges
Earthquake epicenters
Volcanoes
Mantle hotspot centres
Each dataset was tested separately, then compared.
The clearest result: plate boundaries
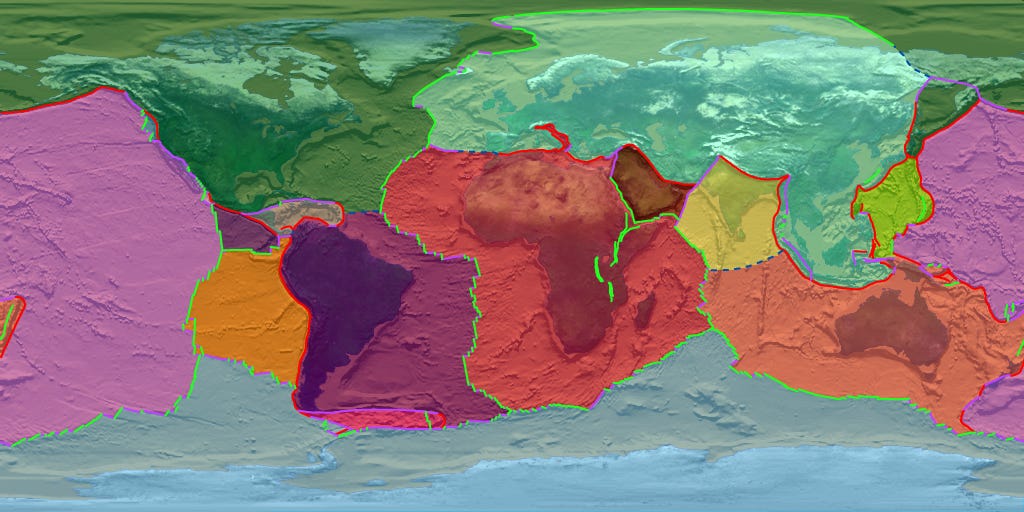
Below is one of the key figures from the study:
Earth’s plate boundaries compared with a highly symmetric reference pattern
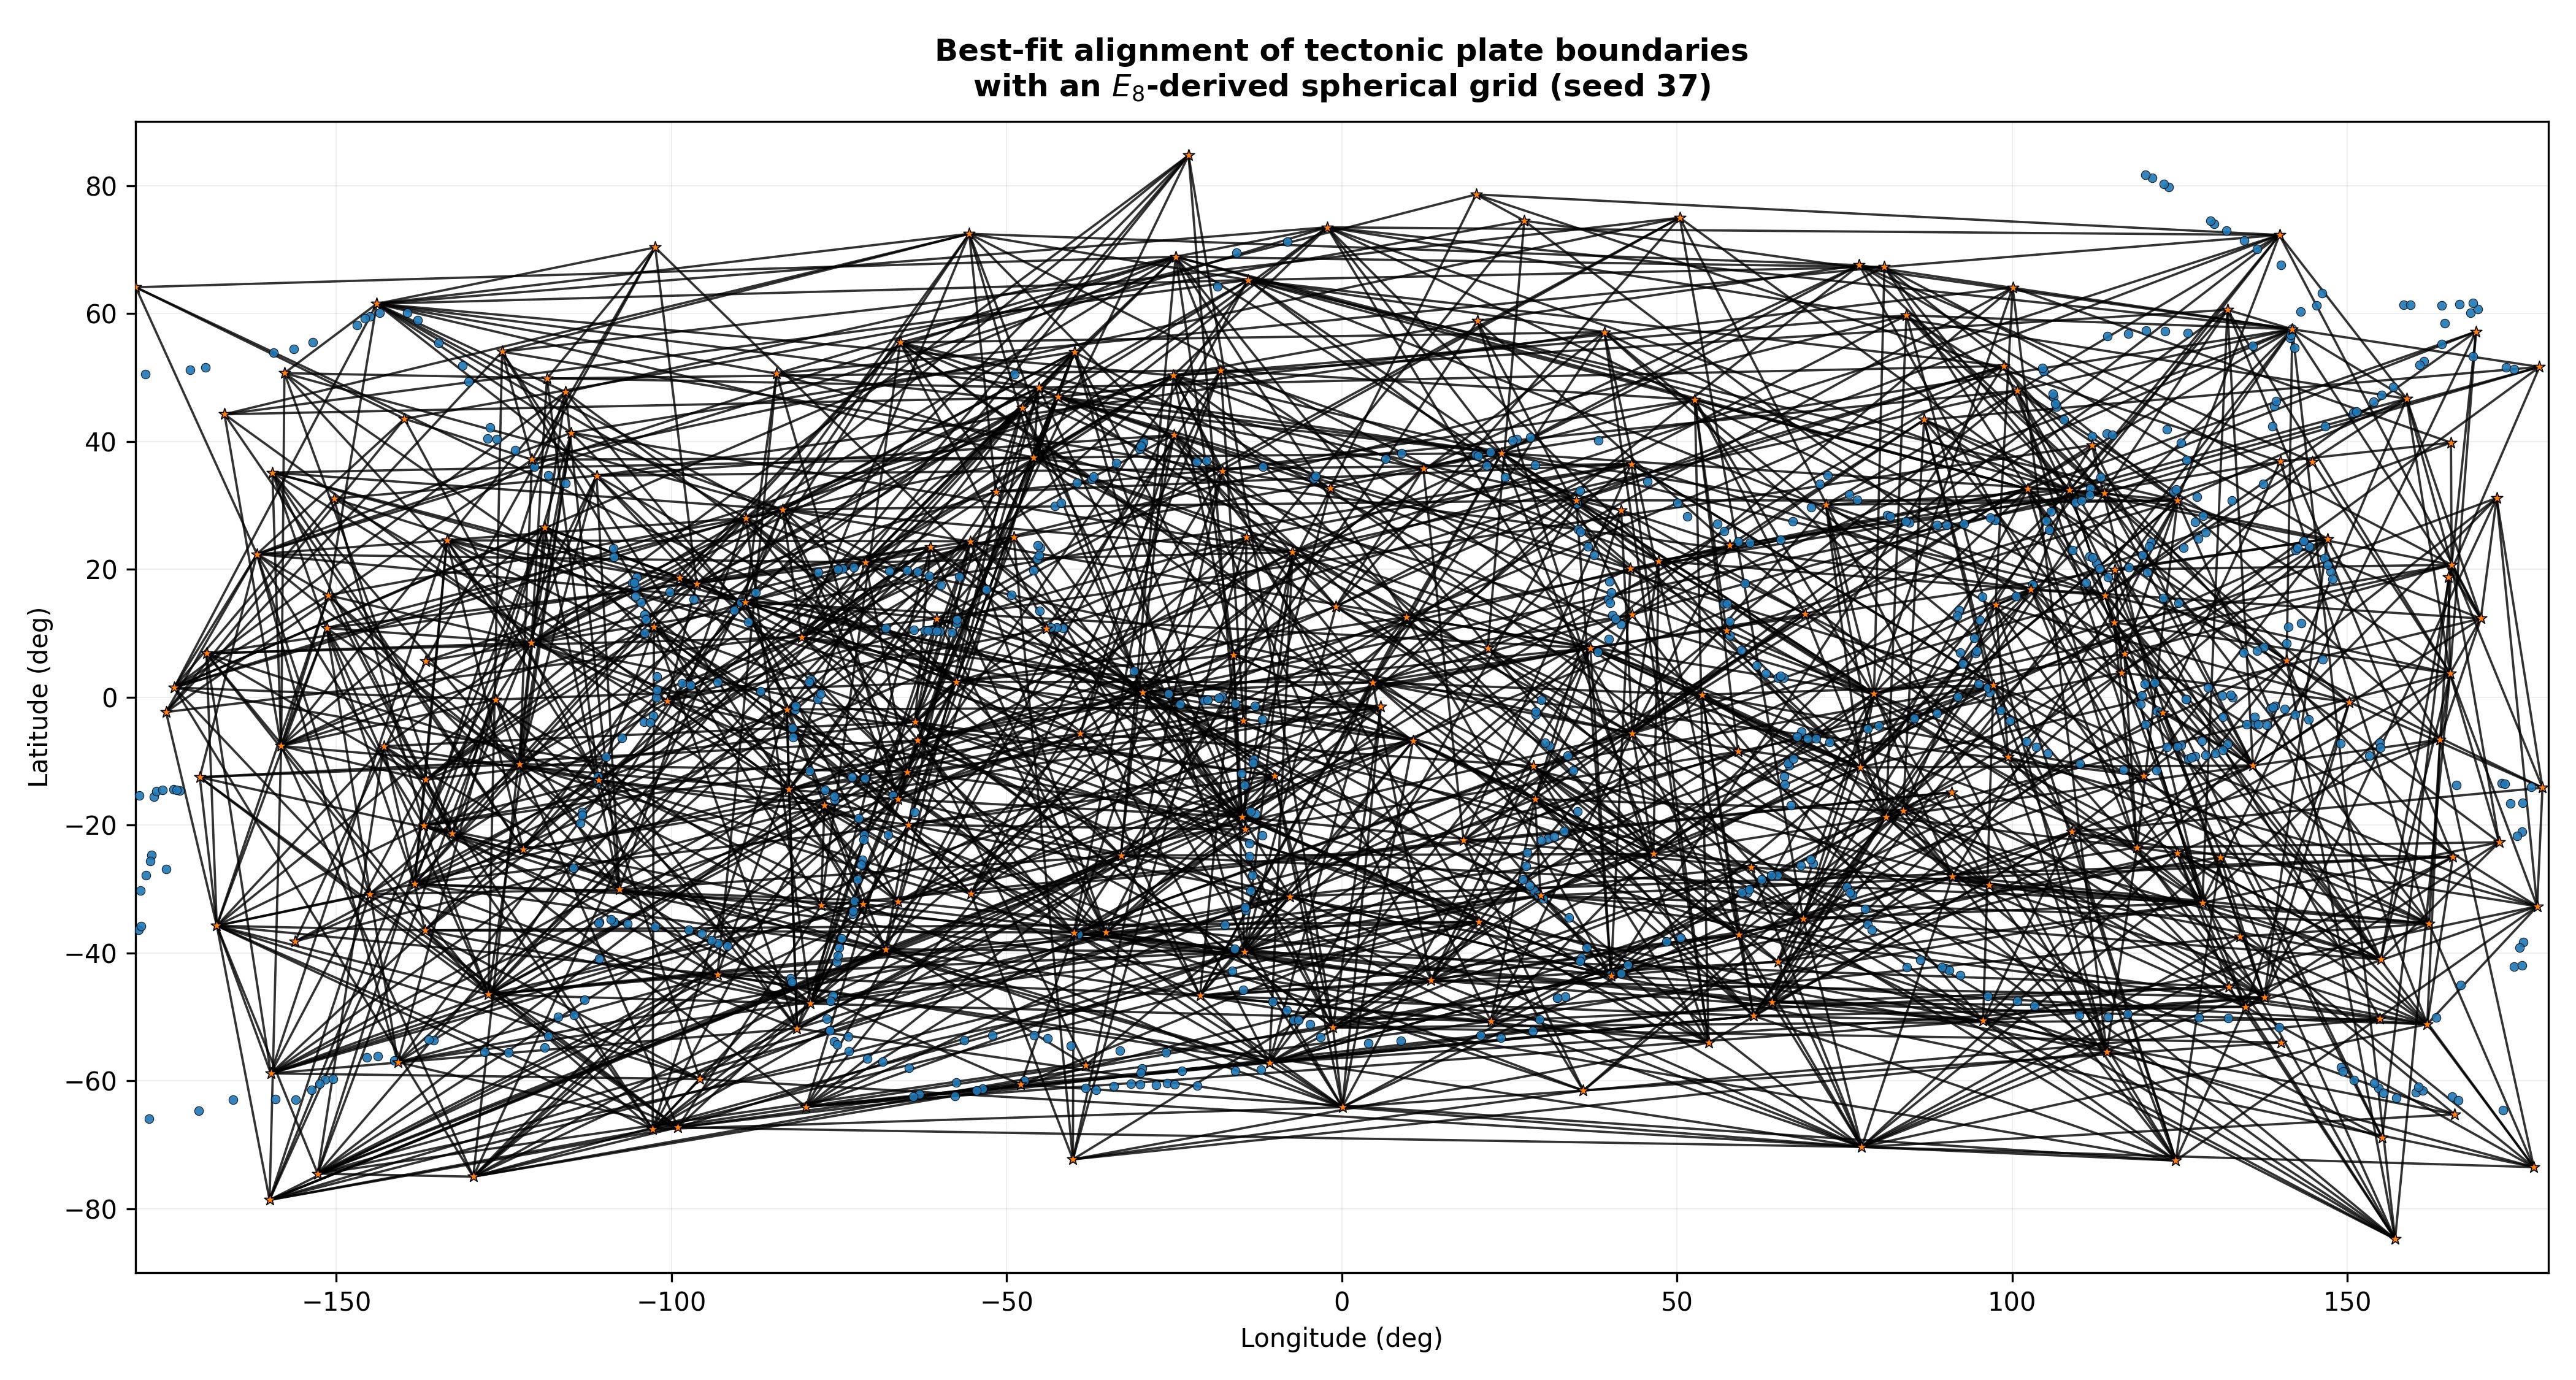
How to read this image:
Colored lines show real tectonic plate boundaries
Thin black lines show a symmetric reference grid
The grid is not a proposed physical structure
The question is statistical: is the alignment stronger than chance?
What the analysis found:
Plate boundaries show the strongest and most robust alignment of all datasets tested.
Even after:
correcting for orientation search bias
randomising Earth thousands of times
changing sampling density
perturbing the network structure
…the signal persists.
This makes plate boundaries a benchmark case: if large-scale geometric organization exists anywhere in Earth's systems, it shows up most clearly here.
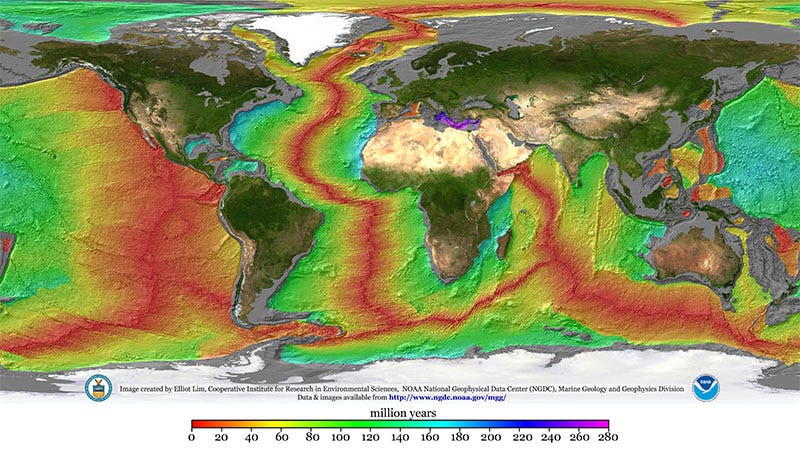
Mid-ocean ridges: a global network effect
Mid-ocean ridges, Earth’s longest continuous geological system, also show statistically significant alignment.
Importantly:
The signal remains when long ridge segments are capped.
It remains when each ridge segment is reduced to a single representative point.
It survives the hardest search-aware statistical tests.
This indicates that the alignment is a collective property of the ridge network, not an artifact of a few dominant features.
Earthquakes, volcanoes, and hotspots: not all patterns are equal
The study also shows where alignment breaks down, which is just as important.
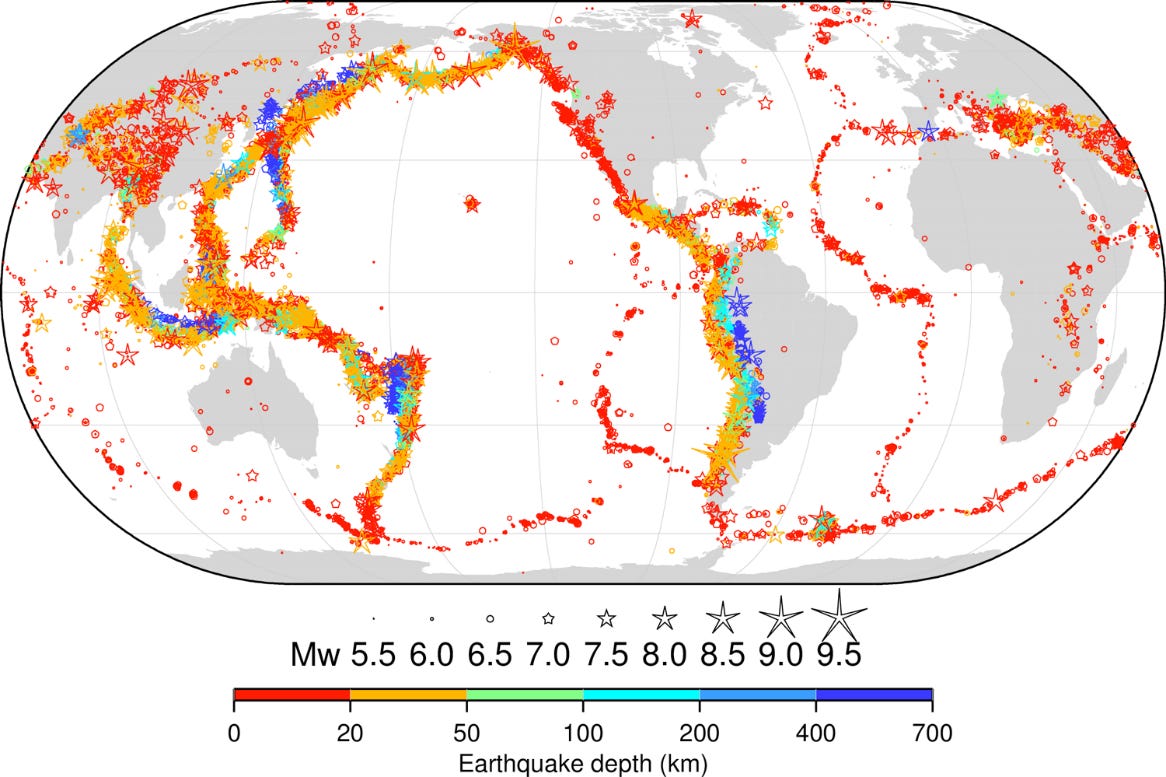
Earthquakes
Show a weaker but repeatable signal
Likely reflect inherited plate-boundary geometry
Are borderline significant under the strictest tests
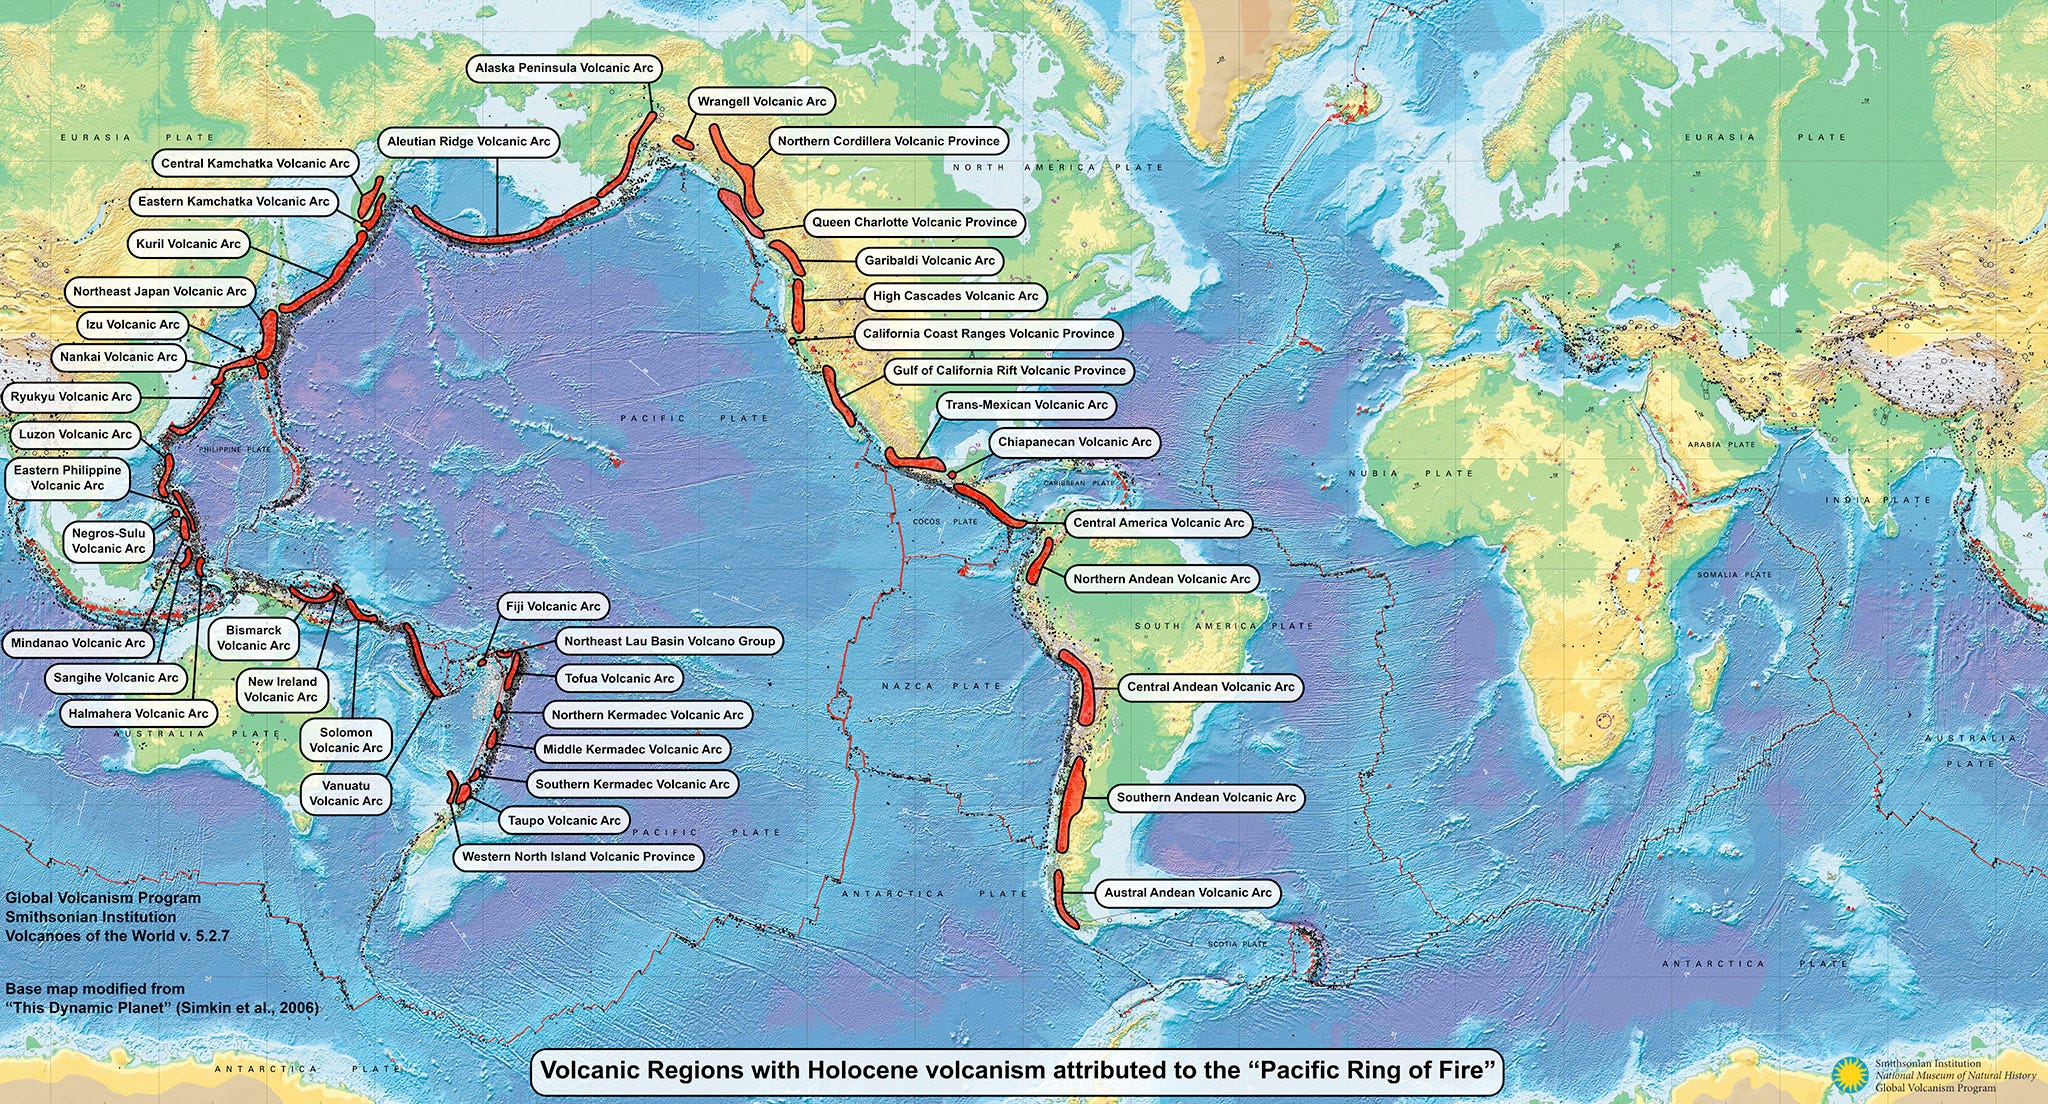
Volcanoes
Show apparent alignment if orientation is fixed
Lose significance once full search bias is controlled
Are consistent with heterogeneous, regional origins
Mantle hotspots
Do not behave as a single global population
When pooled, the signal disappears
When split into Indo–Atlantic and Pacific domains, strong alignment emerges
Cross-domain testing eliminates the signal entirely
This strongly suggests that hotspot geometry is regional rather than global, consistent with mantle convection models.
What this does not claim
Let’s be very clear:
This is not a claim that Earth follows a hidden geometric grid
This is not numerology or cherry-picking pattern fitting
This does not replace plate tectonics
Instead, it establishes a statistical baseline:
Are Earth’s largest systems more globally organized than we would expect from chance alone, given a neutral reference?
That’s a meaningful result, whether the cause turns out to be mantle flow geometry, stress-field organization, rotational symmetry breaking, or something else entirely.
Why is this significant?
Large-scale organization often emerges from complex systems without being explicitly designed.
By showing where geometric coherence exists, and where it doesn’t, we gain:
a new way to compare Earth systems
a framework that can be applied to other planets
a quantitative bridge between geometry and geophysics
This work doesn’t answer why the organization exists.
But it rigorously shows that it does, in some systems, and not in others.
That distinction matters.
📄 Want the full details?
The complete paper, with methods, statistics, and all robustness tests, is now publicly available as a preprint:
👉 ESS Open Archive (DOI preprint):
https://essopenarchive.org/users/1023191/articles/1383068-global-geometric-structure-in-earth-systems-statistical-tests-of-high-symmetry-spherical-grids-against-geophysical-data
Peer review is underway at Geochemistry, Geophysics, Geosystems.
Salah-Eddin Gherbi
Impressive methodolgy. The negative results are probly as valuable as the positives here. Showing that hotspots are regional rather than global, and volcanoes lose significance under strict testing, actually strengthens the plate boundary findings. Most studies would bury those null results but calling them out explicitly makes the whole framework way more credible.
I have looked for that one video that I saw a year or two ago, but haven't found it. Where are you publishing/posting your work, besides here? I'm working on a site/API/app I'm calling Centropy-Project, where I'll have all my new physics and cosmology/consciousness papers, and a full suite of physics generators that people can play around with. I'll make a collaborators tab/page and maybe you would be interested in participating.